faceted
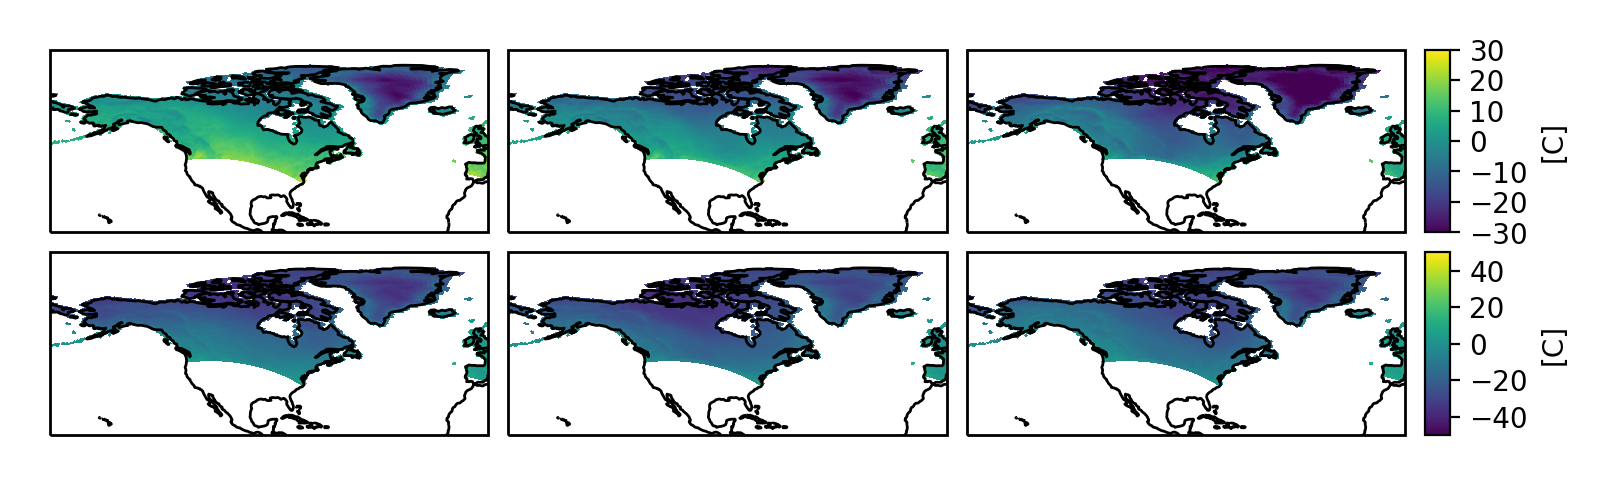
Figures with precise control over overall width, overall height, plot aspect ratio, between-plot spacing, and colorbar dimensions.
Description
The purpose of this module is to make it easy to produce single-or-multi-panel figures in matplotlib with strict dimensional constraints. For example, perhaps you would like to make a figure that fits exactly within a column of a manuscript without any scaling, and you would like the panels to be as large as possible, but retain a fixed aspect ratio (height divided by width). Maybe some (or all) of your panels require an accompanying colorbar. With out of the box matplotlib tools this is actually somewhat tricky.
Internally, this module uses the flexible
mpl_toolkits.axes_grid1.AxesGrid toolkit,
with some additional logic to enable making these kinds of
dimensionally-constrained panel plots with precise padding and colorbar
size(s).
Another project with a similar motivation is panel-plots; however it does not
have support for adding colorbars to a dimensionally-constrained figure. One
part of the implementation there that inspired part of what is done here is
the ability to add user-settable padding to the edges of the figure (to add
space for axes ticks, ticklabels, and labels). This eliminates the need for
using bbox_inches='tight' when saving the figure, and enables you
to make sure that your figures are exactly the dimensions you need for your
use.
Installation
You can install faceted from PyPI:
$ pip install faceted
or directly from source:
$ git clone https://github.com/spencerkclark/faceted.git
$ cd faceted
$ pip install -e .